I
like vintage test gear. The built quality of these old known brands
equipment, is no match for todays full-featured, cheaply-built,
multi-thousand-Euros equipment. Sometimes, such old equipment, have
amazing specifications, even in todays standards, for the price one is
called to pay for them. I wanted to use a vintage vacuum tube
oscilloscope, sweeper, frequency counter, spectrum analyzer and
reference signal generator, to make meaningful measurements in the lab
and possibly be able to do more things than my newer limited-budget
equipment.
The problem I mainly find with such old equipment, is the lack of
markers and the inability of the hobbyist to precisely calibrate them,
since he lacks expensive calibration equipment. To overcome both of
these problems, the technique i have thought of, is what I call the
"comparison method". Instead of having to calibrate precisely each and
every equipment, perform just a rough calibration and rely only on a
reference calibrated signal generator to do the rest. In other words
the "comparison method", transfers the critical calibration to the
reference generator only.
The method is quite simple and it is more easily explained with an
example. Suppose you want to measure the amplitude and frequency of a
test signal, displayed on the screen of an old spectrum analyzer
without markers. The way to do it, is to measure major and minor
divisions in the display graticule, then take into account the
amplitude and frequency settings of the spectrum analyzer. Depended on
how old and calibrated the analyzer is, you can get from adequate
results to totally wrong, but never precise. Apart from analyzer
errors, setup errors or losses will also apply to an extent.
With the method of comparison, nothing of the above matters. The
method, alternatively compares the test signal on the analyzer display,
with the reference generator signal on the analyzer display,
alternatively applied to the input of the spectrum analyzer. By closely
matching the amplitude and frequency of both of these signals, the
amplitude and the frequency of the test signal is read on the reference
generator screen. It's as simple as this. The same teqhnique applies
also in the time domain (oscilloscope) to measure amplitude and
frequency, although more tricky for frequency, taking into account the
distortion of the test signal. However, we do not need to worry for the
relative phase difference of the two signals, because the scope trigger
will take care of this.
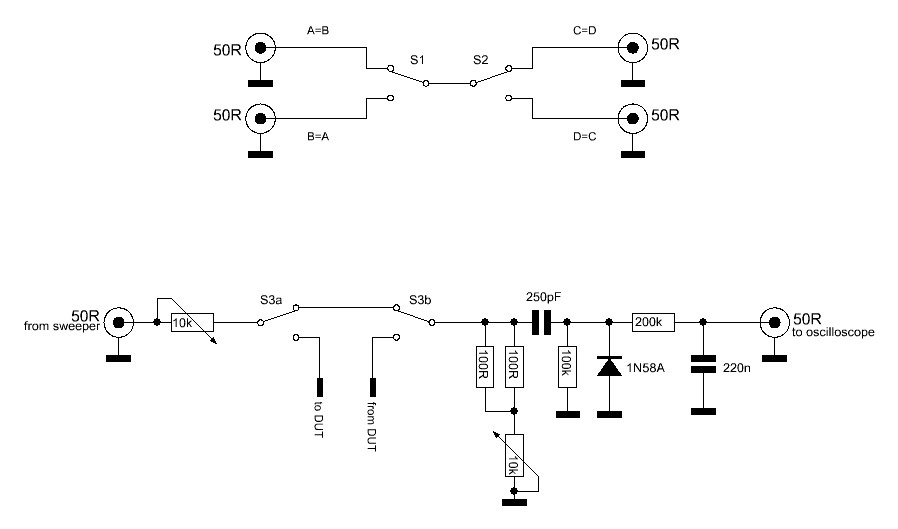
The first schematic in the picture below, shows a circuit that I have
built to exploit the comparison method. It is a simple passive
two-switch device that allows instant switching any of the ports on the
left, to any of the ports on the right. For example, you can connect
the test signal and the reference generator to the left ports and the
spectrum analyzer and a frequency counter to the right ports. By single
switches flip, you can instantly select either the test signal or the
generator to be sisplayed on the analyzer display. If your reference
generator has no frequency display, you can select the counter
instantly and measure the frequency of the generator, after you have
matched it to the test signal.
The device can be used bidirectionally and in many ways to achieve the
desired test setup. Depended on the operating frequencies (my interest
was on HF) you might want to build variations of the circuit with
coaxial relays. Note however, that any losses will apply to both the
test signal and the reference signal, so effectively they cancel out. I
would say that the important thing, is the leakage between the
switches, rather than their operating frequency or loss. We have to be
very careful what we compare, if we are to get accurate results. Thus,
another important thing, is that the pair of coaxial cables that
connect the equipment on the left, must be of exactly equal length and
type. Similarly, the pair of
coaxial cables that connect the equipment on the right, must be of
exactly equal length and type. But the pair of cables on the right, do
not need to be of equal length and type with the pair of the cables on
the left. The device will not only provide you with measurements and
connections flexibility, but it will also save your precious connectors
from wear by continuously plugging them in and and out.
Apart from the markers/measurement
ability, I wanted a test jig that could be used to accurately measure
the response curves of devices such as filters, amplifier blocks,
cables etc. Therefore, I designed the circuit at the bottom of the
above image. This passive circuit is a very useful addition to any lab,
that has a calibrated amplitude sweeper with ramp output and a low
bandwidth oscilloscope. Old timers, TV and radio technicians, used
signal tracers and generators/sweepers and detector probes to properly
peak the IF filters in these devices. My circuit differs a bit in the
sense that it can be used not only to peak or see the response, but
also to actually measure it.
You dont need a spectrum analyzer to perform these frequency domain
measurements, your old low bandwidth oscilloscope will suffice! The RF
output of the calibrated amplitude sweeper, is applied on the left
port. The device under test (DUT) is connected to the DUT port. Do not
forget to connect the ground to the DUT too. In my version I used
aligator clips with short leads for these connections (interested on HF
frequencies). S3 switches the DUT inline or bypasses it. On the right
side, there is the peak detector (demodulator) that converts RF to DC.
I used the 1N58A Germanium diode for its low voltage drop and huge
reverse voltage breakdown (100-120v). The detector is a sligh variation
of an old General Electric circuit. The oscilloscope is connected to
the right port and make sure that the coupling of the oscilloscope is
set to DC.
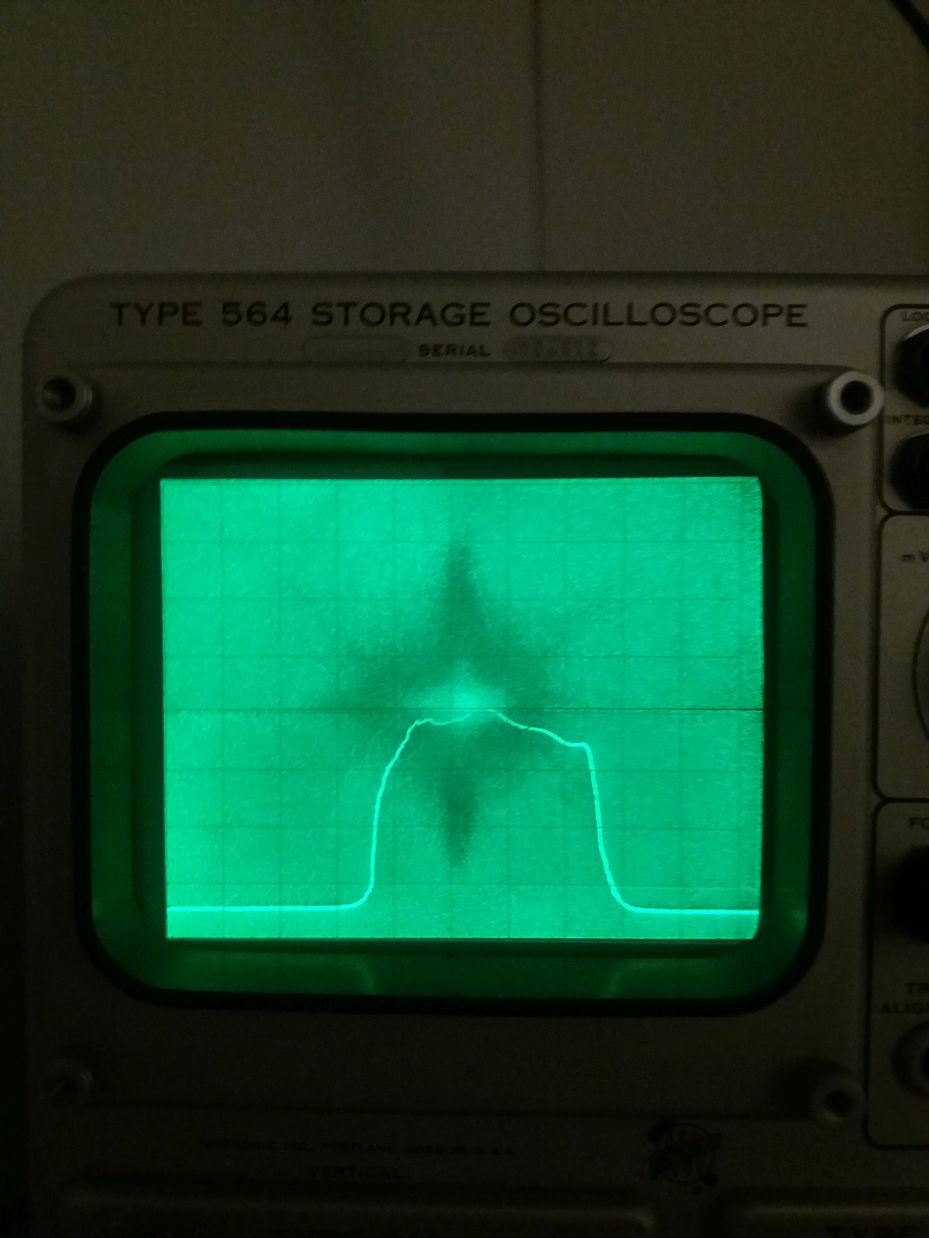
The potentiometers are a very important element of the circuit. They
are used as input and output impedance set for the DUT. This is very
important. In the picture below, you can see the response of a 455KHz
mechanical filter when not properly terminated in its input and output.
The filter is supposed by design to have a relatively flat response,
and this is by far non-flat.
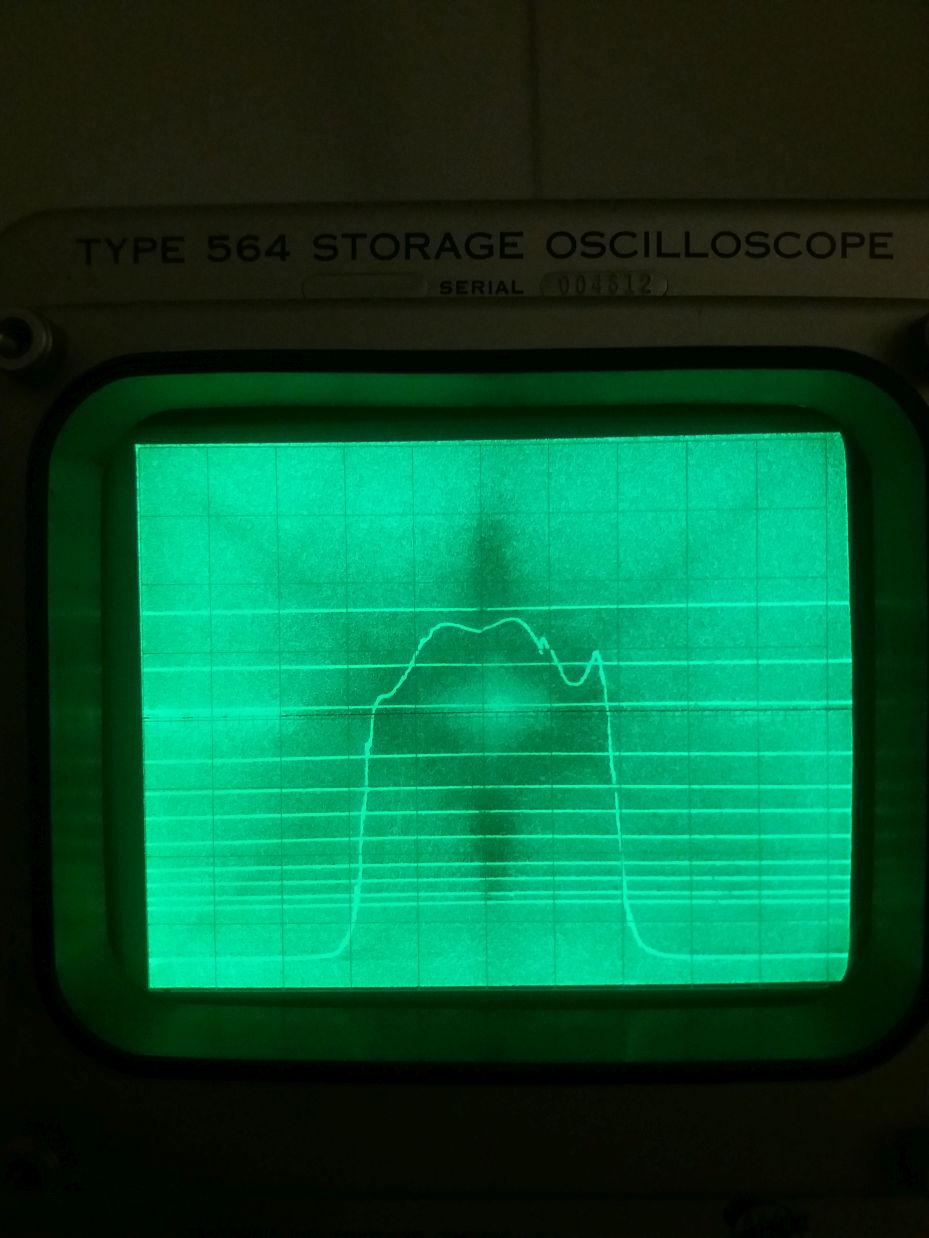
In the picture below, you can see the response of the same filter, when the input and output potentiometers are set to more proper values. This is quite a difference, isnt it?
A side effect of the
potentiometers, is that they vary the amount of signal applied to the
DUT and also to the detector. A better approach would be to use other
impedance matching elements such as inductors and capacitors, or active
elements. However, a variable resistor is easily set up, it is more
frequency independent and pretty much of known impedance values, since
the inductive and capacitive component is low. At the end, with the
comparison method, it does not matter much how much signal arrives at
the DUT and the detector, as long as the comparisons are performed with
the same initial signal level.
To better understand how this jig works, I will give you an example of
measuring the response of a filter. The sweeper is set to manual sweep.
That is, the user moves the frequency knob manually which results in
manual control of the sweep ramp. The sweep ramp signal is connected to
the horizontal input of the oscilloscope, or to the horizontal control
of an XY display. The oscilloscope must be of storage type for manual
sweeps and for this method to work, like the Tek 564 for example. S3 is
set to put the DUT inline. Then the user manually sweeps across the
filter frequency and the filter response is shown on the CRT of the
oscilloscope.
The next step is to trim the input and output potentiometers to achieve
the desirable filter response. Several manual sweeps may be required
during this phase. When the response is the desirable, erase the CRT
and make a final sweep. This is the response curve of your filter. To
measure the frequency at any point onto the curve of the filter, lower
down the intensity of the oscilloscope beam to the point where the dot
is just visible, but not be able to "write" to the screen. Then sweep
across and bring the dot to the desirable curve point. Measure the
frequency of the sweeper at that point with a frequency counter, if
your sweeper does not have a digital frequency display readout.
Next, I like to draw some
reference lines on the storage CRT, to more easily measure the
amplitude-related things of the filter. To do so, increase the beam
intensity, switch S3 to bypass the DUT and without changing the values
of the potentiometers (important) or the RF level of the sweeper,
perform another sweep. This sweep line is your top reference line and
it should be equal or at higher position than the top curve of the
filter. Reduce the RF amplitude of the sweeper by the step-size you
want (eg 1dB, 3dB, 6dB etc) and draw another line. Then another line by
less level and so on.
The picture below, shows these horizontal level lines. Each one is at
1dB difference compared to the nearby ones. Notice that the spacing of
the lines is not linear. This can be partially due to oscilloscope
mis-calibration and partially due to detector non-linear response on
different signal levels. However, it does not matter much, since both
the curve and the lines are drawn with the same conditions. It does not matter if the detector is
linear because any non-linearities will be shown on these horizontal
lines. So if you see a slight notch on the curves and a slight notch on
your filter response, this meas that the notch is from the detector and
not from the filter. This might be noticed in wideband filters. In low
bandwidth IF filters any detector non-linearities are not present.
The top reference line level is unknown and it is not the same as the
sweeper output level, since these potentiometers vary this level
anyway. However, we know that the line below it, is at -1dB from that
reference level and the next lines -1dB each. Therefore we can measure
the filter bandpass loss in dB, as well as the overal response of the
filter. We can also fine-measure any amplitude within these steps, by
bringing the beam intensity down so that the beam is barely visible and
not able to write on the CRT. Then manually varying the calibrated
amplitude of the sweeper between these amplitude steps and also perhaps
the frequency of the sweeper, to bring the dot onto the curve if
desired.
Once the DUT has been measured and when you are happy with its curve,
based on the I/O impedances, then remove it from the aligator clips and
make sure S3 is flipped to the DUT position. Then measure the
resistance from the clip marked "to DUT" to the sweeper port (with the
sweeper disconnected of course). This is the series input impedance
that you must include in the circuit your DUT is to be installed in, so
as to achieve the same response. Then measure the resistance from the clip marked "from DUT" to the ground. This is the shunt output impedance that
you must include in the circuit your DUT is to be installed in, so
as to achieve the same response.
If your oscilloscope is of low bandwidth, you can still do power
measurements if you combine the top and the bottom circuits. You can
connect your reference generator to one port on the left and the test
signal to the other on the left. Then connect one of the output ports
to the input port of the detector and bypass the DUT. You will then see
two lines on the oscilloscope CRT as you switch between the test signal
and the generator one. Set your generator amplitude to match the two
lines on the screen. Then read the amplitude value on your generator.
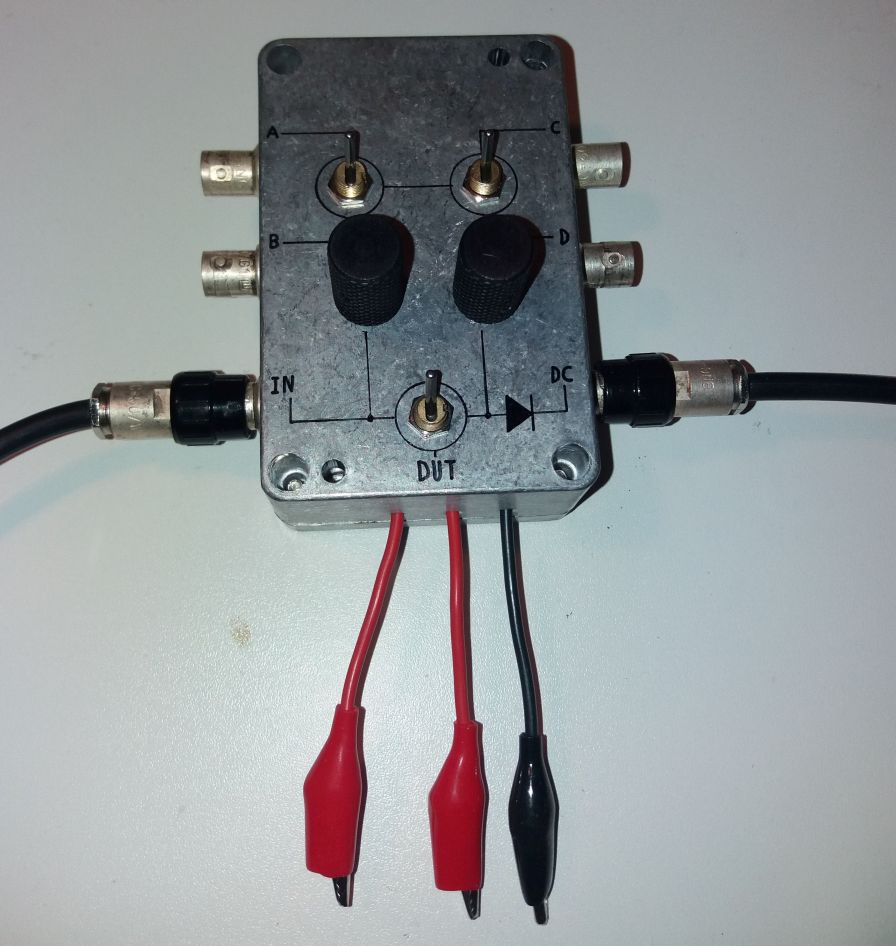
The first picture on this page, shows the way the jig was built. Both
circuits were placed inside the same die cast enclosure. All the
components used, are of the finest quality. Silver plated connectors,
mil-spec toggle switches, sealed potentiometers and knobs. The aligator
clips cables are silicone-insulated, but I could not find good quality
aligator clips.
Here is a video that shows the testing of the detector inside this jig.